Technical analysis is a method of evaluating financial markets by examining past market data - primarily prices and trading volumes - to forecast future price movements. Unlike fundamental analysis, which studies a company’s financial performance and economic factors, technical analysis focuses on price patterns and statistics under the premise that all relevant information is already reflected in the market price. This approach is a form of active trading strategy and stands in contrast to modern portfolio theory and the efficient-market hypothesis, which hold that price changes are largely unpredictable. Over the years, the efficacy of technical analysis has been debated; some studies find limited or mixed evidence of its predictive power. Nevertheless, it has become a widespread practice among traders and investors, used in conjunction with charting tools and indicators to time entry and exit points in the market.[4]
Historical Development and Theoretical Context
Some concepts underlying technical analysis can be traced back centuries. In 17th-century Amsterdam, Joseph de la Vega’s accounts of the Dutch stock market described early observations of price movements. In 18th-century Japan, rice trader Munehisa Homma developed methods to visualize price data that evolved into candlestick charting techniques still used today. These candlestick charts, which graphically show an asset’s open, high, low, and close prices for a given period, laid early groundwork for pattern analysis in markets.[6]
Modern technical analysis as a discipline began to take shape in the late 19th and early 20th centuries. Financial journalist Charles Dow (founder of The Wall Street Journal) collected and studied U.S. stock market data in the late 1800s and noted recurring trends and cycles. His ideas, published in editorials, formed the basis of what later became known as Dow Theory[4], one of the first formal approaches to analyzing market trends. (Ironically, Dow himself did not explicitly promote using these patterns as a trading strategy.) Dow’s successors, including William P. Hamilton and Robert Rhea, further refined these concepts, and by the mid-20th century technical analysis was formalized by authors like Robert D. Edwards and John Magee, whose 1948 book Technical Analysis of Stock Trends[3] became a seminal text focusing on chart patterns and trend behavior. Early practitioners primarily relied on hand-drawn charts to identify patterns, since computing technology was not yet available for complex data analysis.
Throughout the 20th century, technical analysis gained popularity as more patterns and indicators were devised. Analysts like Ralph Nelson Elliott (proponent of Elliott Wave Theory)[17], William Delbert Gann (known for geometric angle analysis)[18], and Richard Wyckoff (who studied price-volume relationships)[16] each developed their own techniques in the early 1900s, contributing to the growing body of technical methods. By the late 20th century, technical analysis had expanded to include hundreds of identified chart patterns and statistical indicators. The advent of computers and electronic price data revolutionized the field: complex calculations and backtesting of trading rules became feasible, enabling systematic trading strategies based on technical signals. This era also saw the establishment of professional organizations (such as the Chartered Market Technicians Association[19] and the International Federation of Technical Analysts[20]) that helped standardize the field’s knowledge base and certify practitioners.
The theoretical underpinning of technical analysis has also evolved. While early chartists operated largely on empirical observation, later decades brought attempts to explain why technical patterns might work. The rise of behavioral finance provided a framework: recognizing that investors are not always rational, researchers suggested that recurring patterns in prices could result from cognitive biases, herd behavior, and crowd psychology. For example, Paul V. Azzopardi introduced the term “behavioral technical analysis,” merging classical chart analysis with insights about investor emotions and decision-making. In essence, the field increasingly acknowledged that market psychology - waves of fear and greed - might cause prices to move in trends or cycles, thereby giving credence to the patterns long observed by technicians.
Fundamental Principles and Assumptions
Technical analysis is built on a few key principles or assumptions about markets and investor behavior. Technical analysts assume that all available information - company fundamentals, economic data, news events, etc. - is already priced into a security’s market price. In other words, the visible price and volume history reflect the collective knowledge and sentiment of all market participants. Therefore, instead of poring over balance sheets or economic indicators, technicians trust that the price itself is the most informative data. This principle, sometimes summarized as “price knows everything,” parallels the idea that the market is an efficient aggregator of information, but technical analysts use it to justify focusing exclusively on market data.
Rather than fluctuating in a completely random fashion, prices are believed to exhibit directional trends over time. A trend means the price tends to continue moving in the same direction (up, down, or sideways) until some force causes it to change direction. This concept was formalized in Dow Theory[4] and is intuitive: for example, in an uptrend, each successive peak and trough in the price chart is higher than the previous, indicating persistent buying interest. In a downtrend, each rally fails at a lower high and each sell-off reaches a lower low, reflecting sustained selling pressure. Technicians view trend identification as crucial - akin to recognizing the prevailing current in a river before trying to swim. The adage “the trend is your friend” captures the idea that trades aligned with the prevailing trend have a higher probability of success.
A core belief is that human psychology causes repeating patterns in market behavior. Investors and traders, collectively, often react to similar stimuli (such as greed during rallies and fear during sell-offs) in consistent ways over time. As a result, certain price patterns recur and can be recognized on charts. In practical terms, if a particular chart formation signaled a bullish reversal in the past (for example, a head and shoulders top foreshadowing a downturn), traders anticipate it may do so again in the future, because market participants often respond with comparable emotions and actions. Technical analysts acknowledge that while individual events in the market are never identical, psychological cycles (optimism to pessimism, etc.) lead to analogous shapes and sequences in price charts. This repetitive nature is what makes technical forecasting conceivable - it’s premised on the idea that patterns of the past can guide the future. For instance, extreme optimism often precedes market tops, and extreme pessimism precedes bottoms, a notion that aligns with contrarian investing sentiment surveys.
These assumptions highlight the emphasis on market psychology in technical analysis. Even if the reasons behind a price move are not immediately clear, technicians argue that the how (the pattern of the move) is more important than the why. By analyzing what investors are collectively doing (buying or selling, indicated by price/volume patterns), one can potentially infer what they will do next. It is implicitly understood, however, that technical analysis does not guarantee certainty - it deals in probabilities based on past tendencies, and as often quoted in finance, “past performance is not a guarantee of future results.”
Price Charts and Patterns
The primary canvas of technical analysis is the price chart. Analysts typically plot an asset’s price over time (using chart types such as line charts, bar charts, or the popular candlestick charts) and visually inspect these charts for recognizable patterns. Classic chart patterns are essentially shapes or configurations formed by price movements that are thought to have predictive value. For example, a head and shoulders pattern features three peaks (the middle one being highest, resembling a head flanked by two shoulders) and often signals a bullish trend’s reversal into a bearish trend.[1]
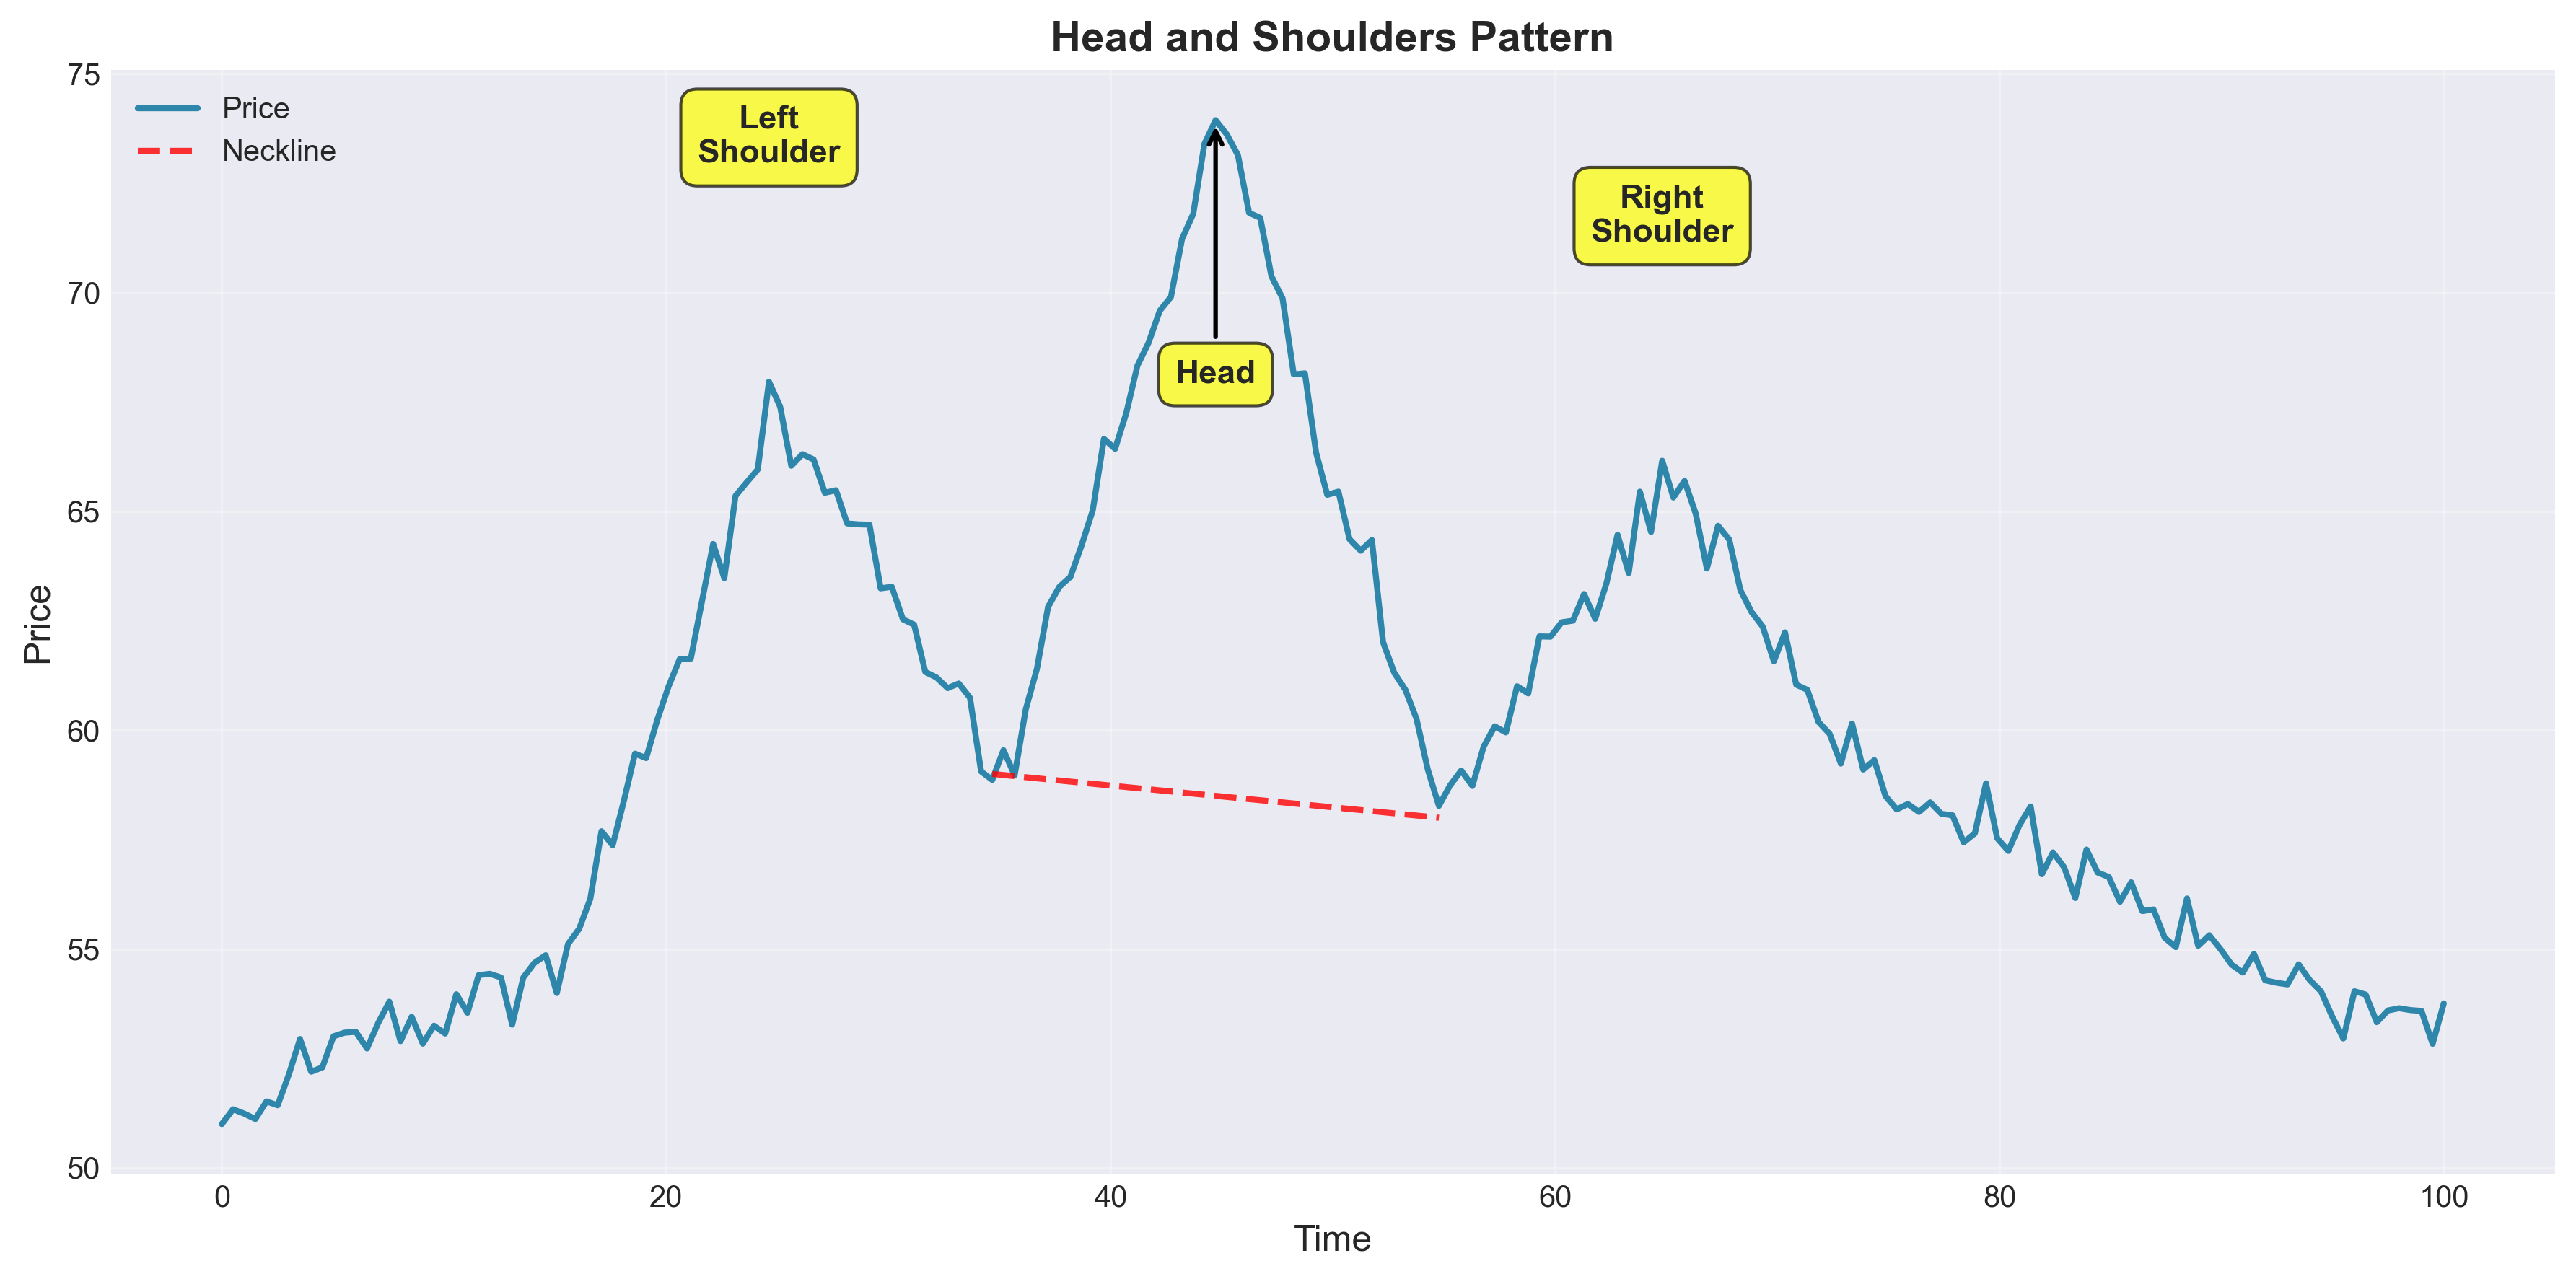
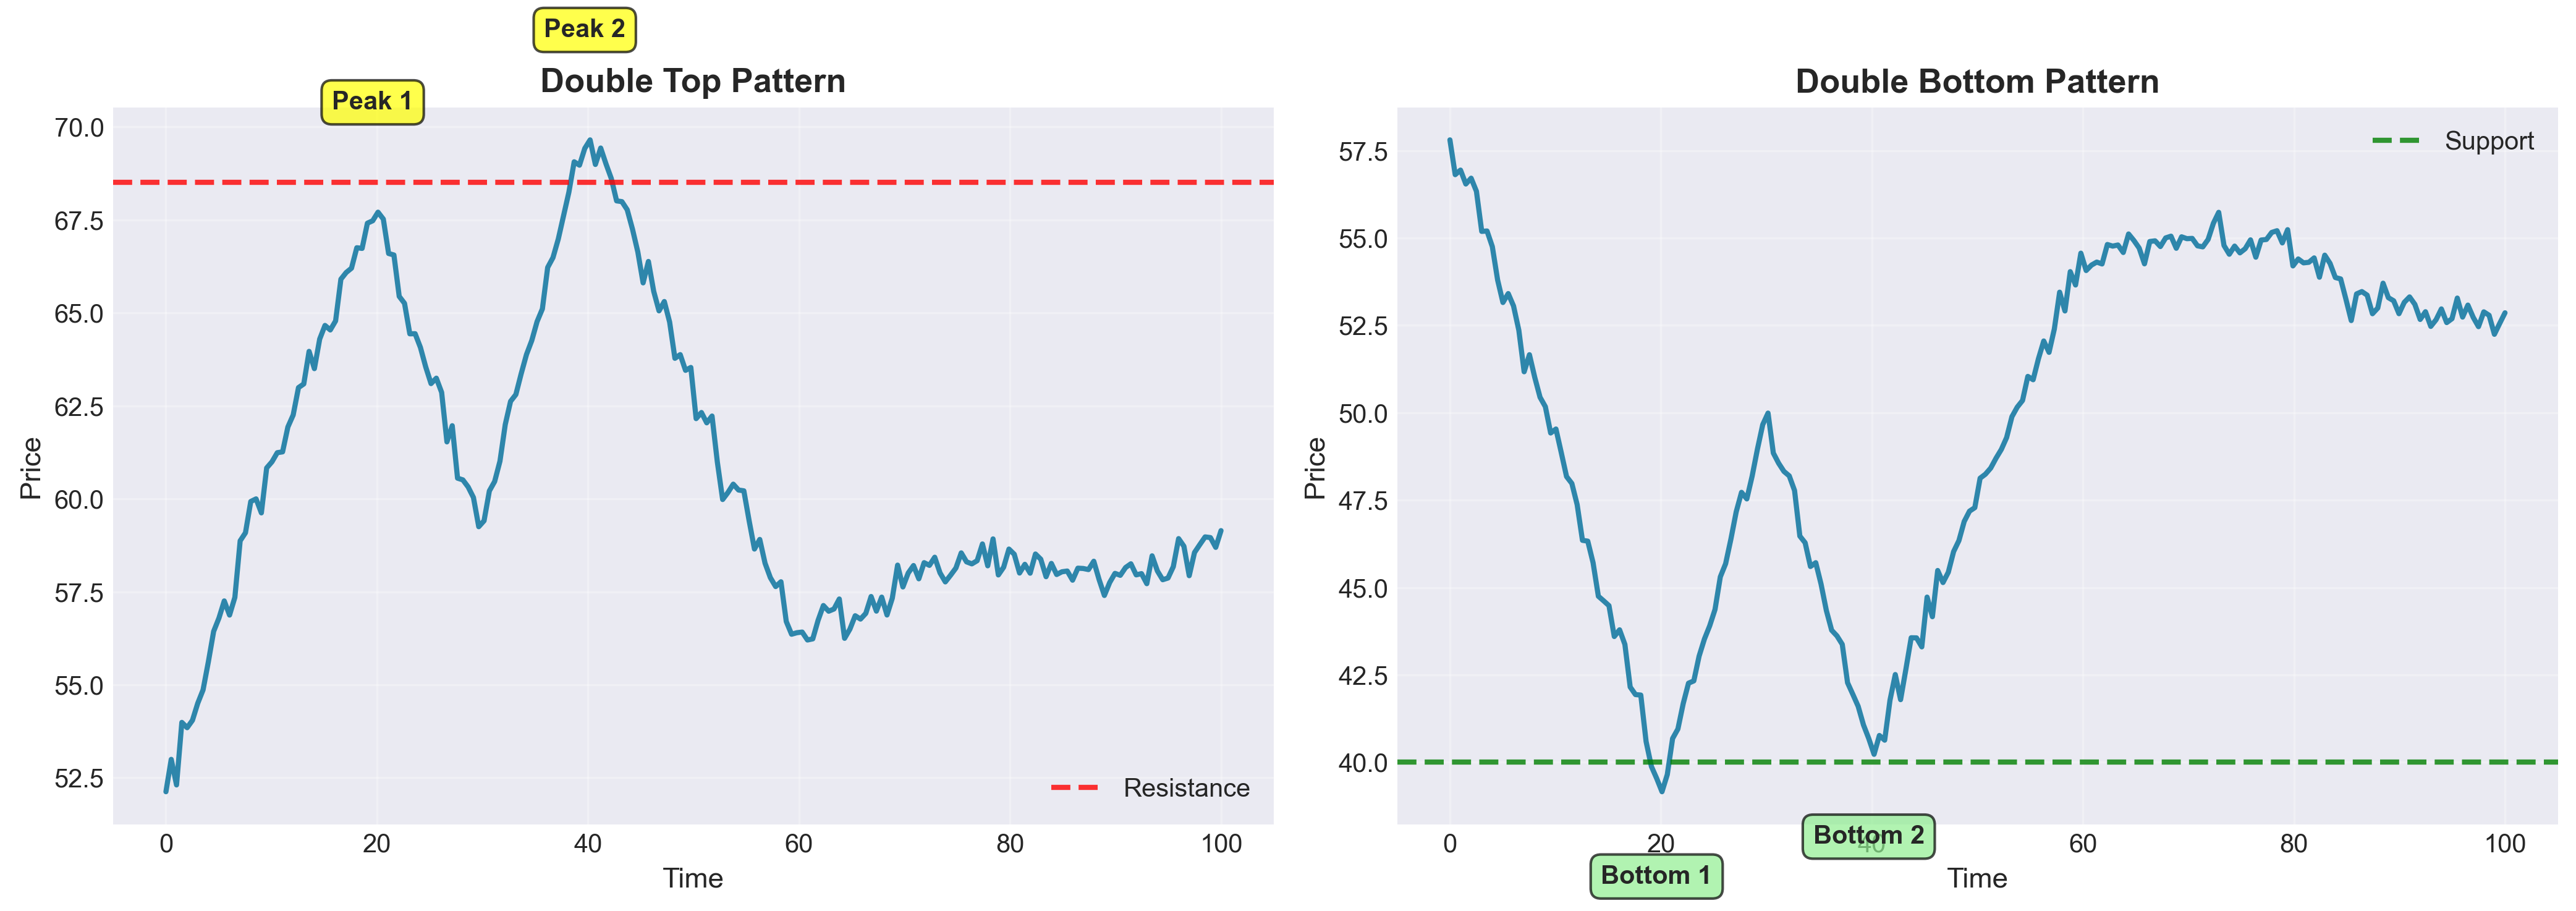
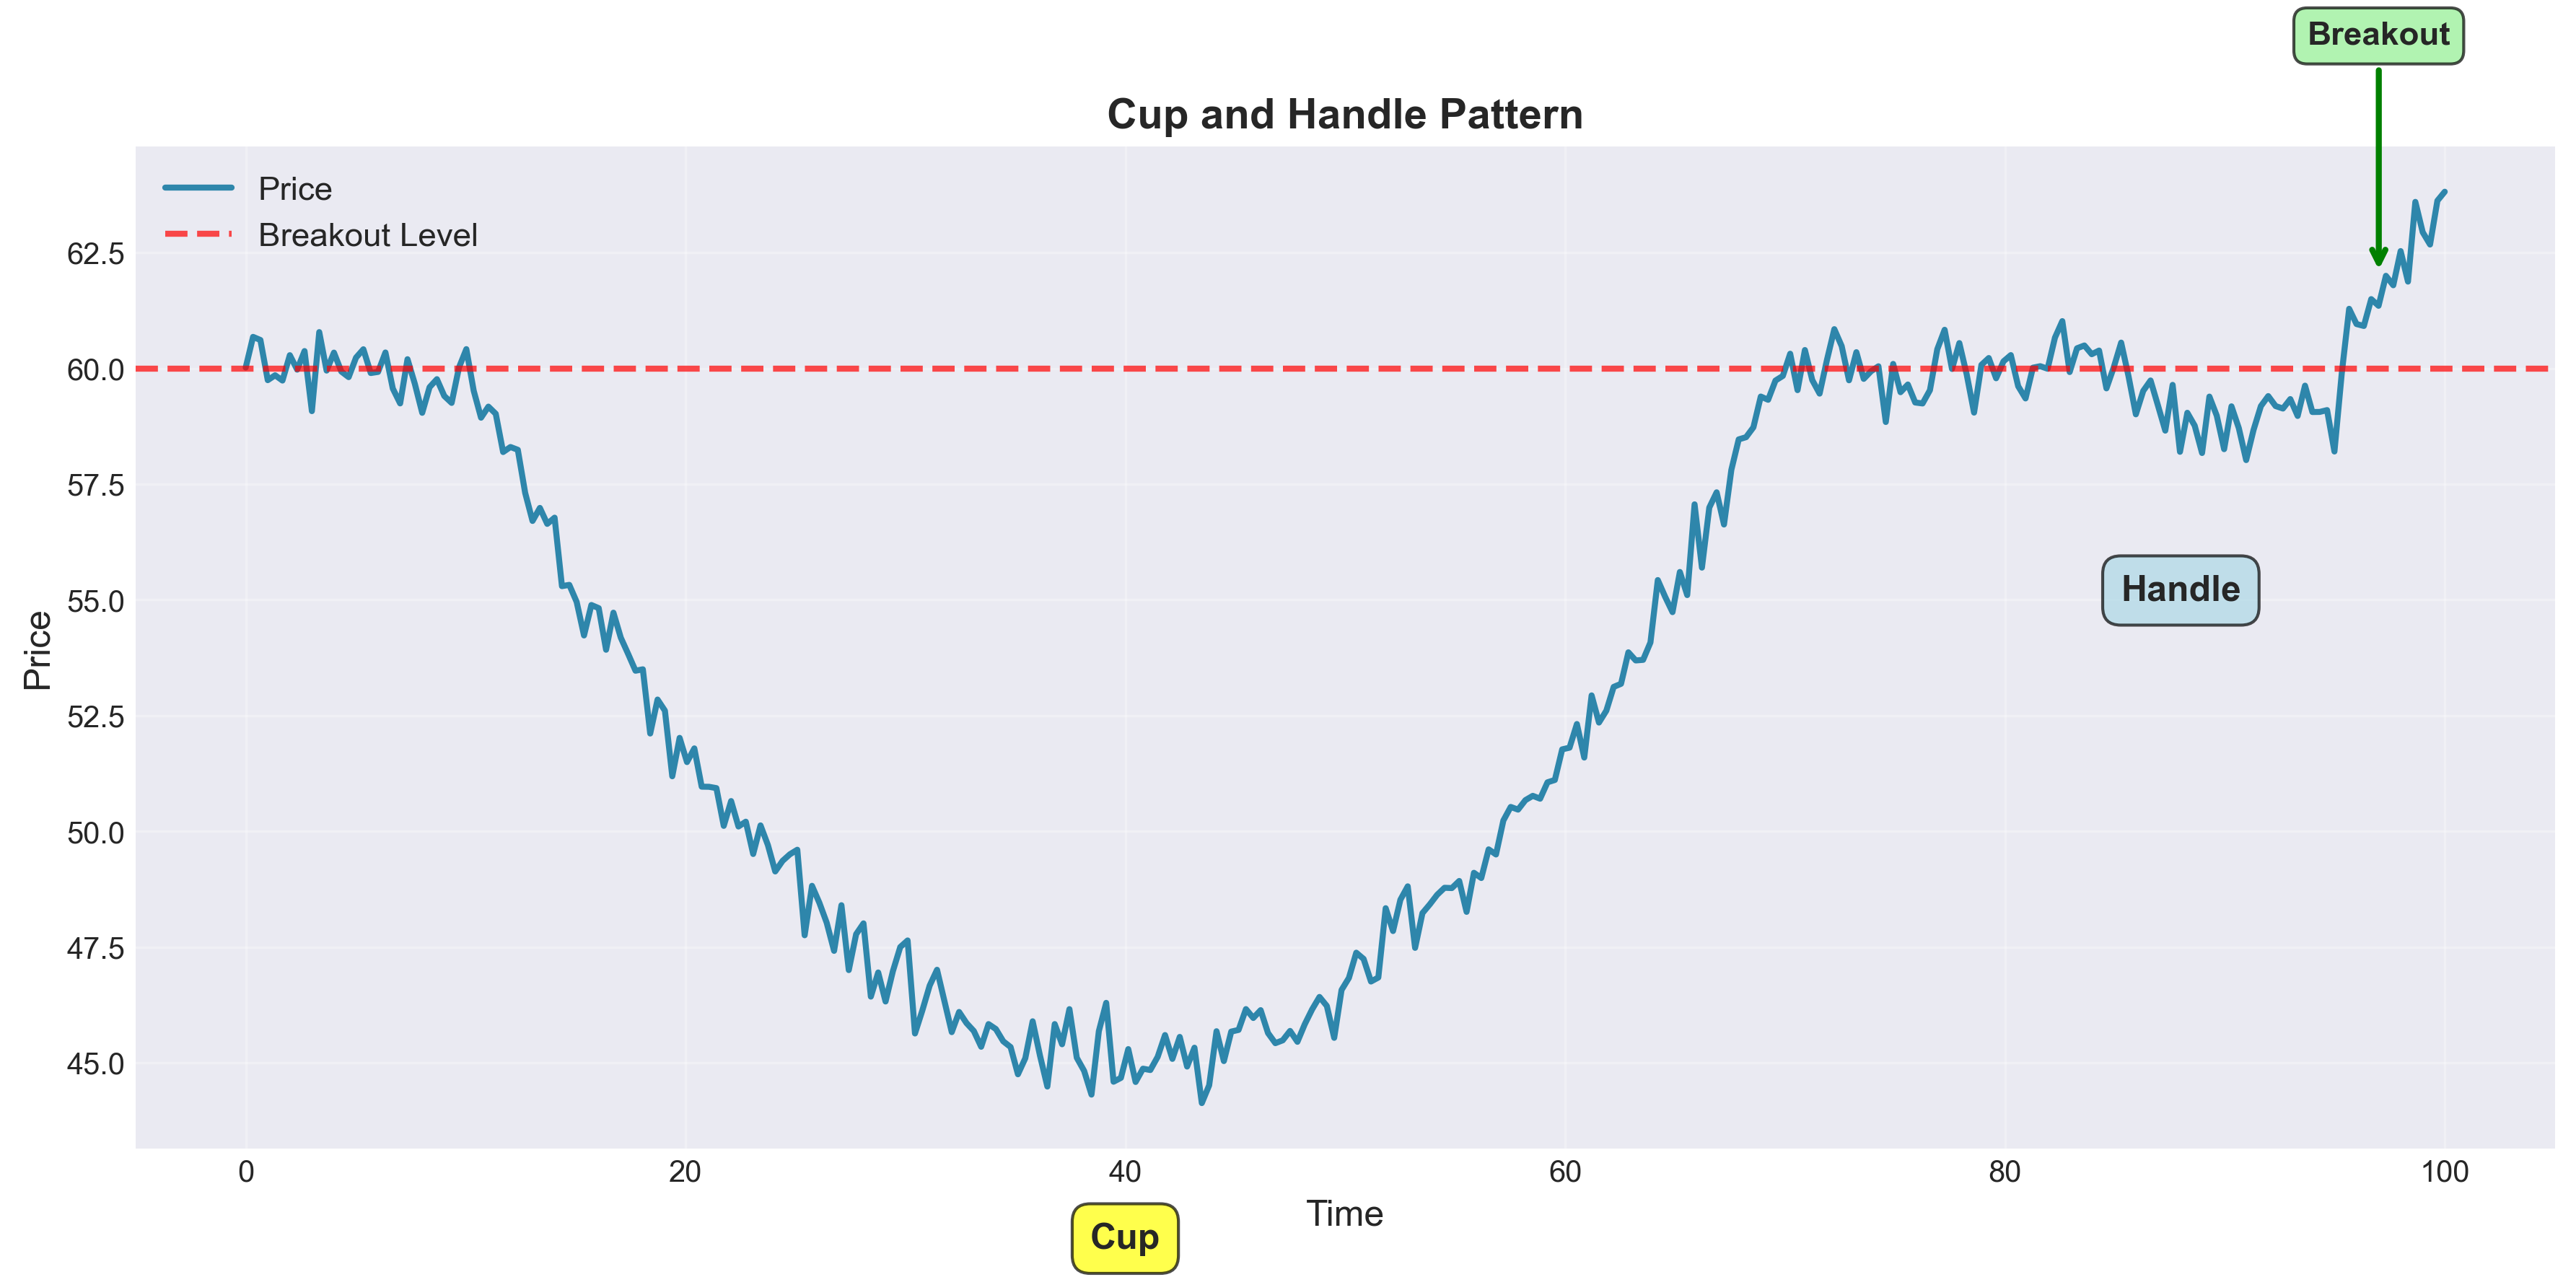
Conversely, an inverse head and shoulders (upside-down pattern) can indicate a bearish-to-bullish reversal. Other well-known patterns include double tops and double bottoms (twin peak or trough formations suggesting a trend is likely to reverse)[5], flags and pennants (small, brief consolidations that look like flags or triangles, often indicating a continuation of the prior trend)[5], and cup-and-handle patterns (a rounded “U” shape followed by a short pullback, resembling a teacup, which can precede an upward breakout).
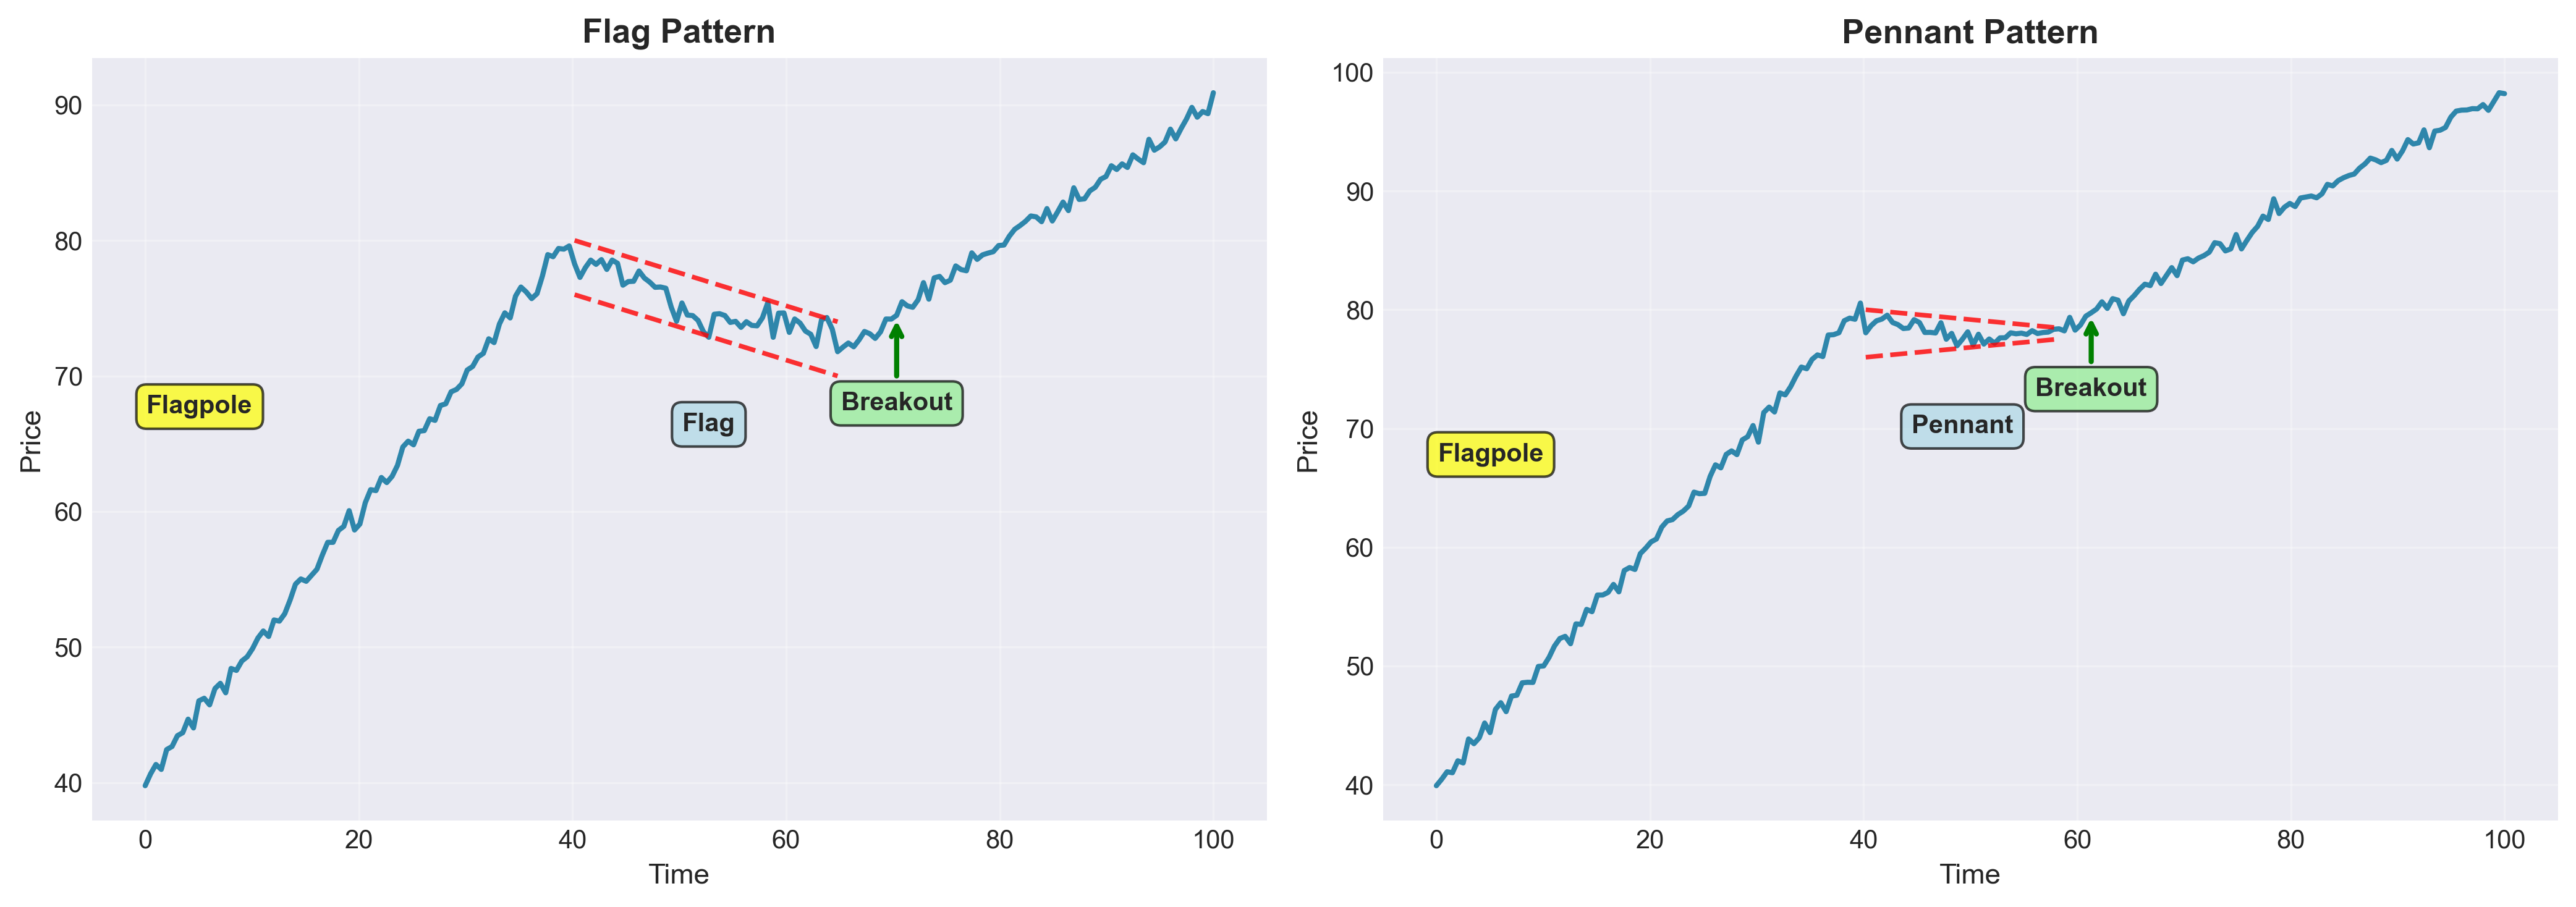
These patterns are often named for their visual appearance or the behavior they imply - for instance, a flag pattern can resemble a flag on a pole and usually marks a pause before the previous uptrend resumes. Chartists draw trend lines to connect significant highs or lows, delineating the slope of a trend and identifying potential support or resistance levels along that trend.[4]
Technical Indicators
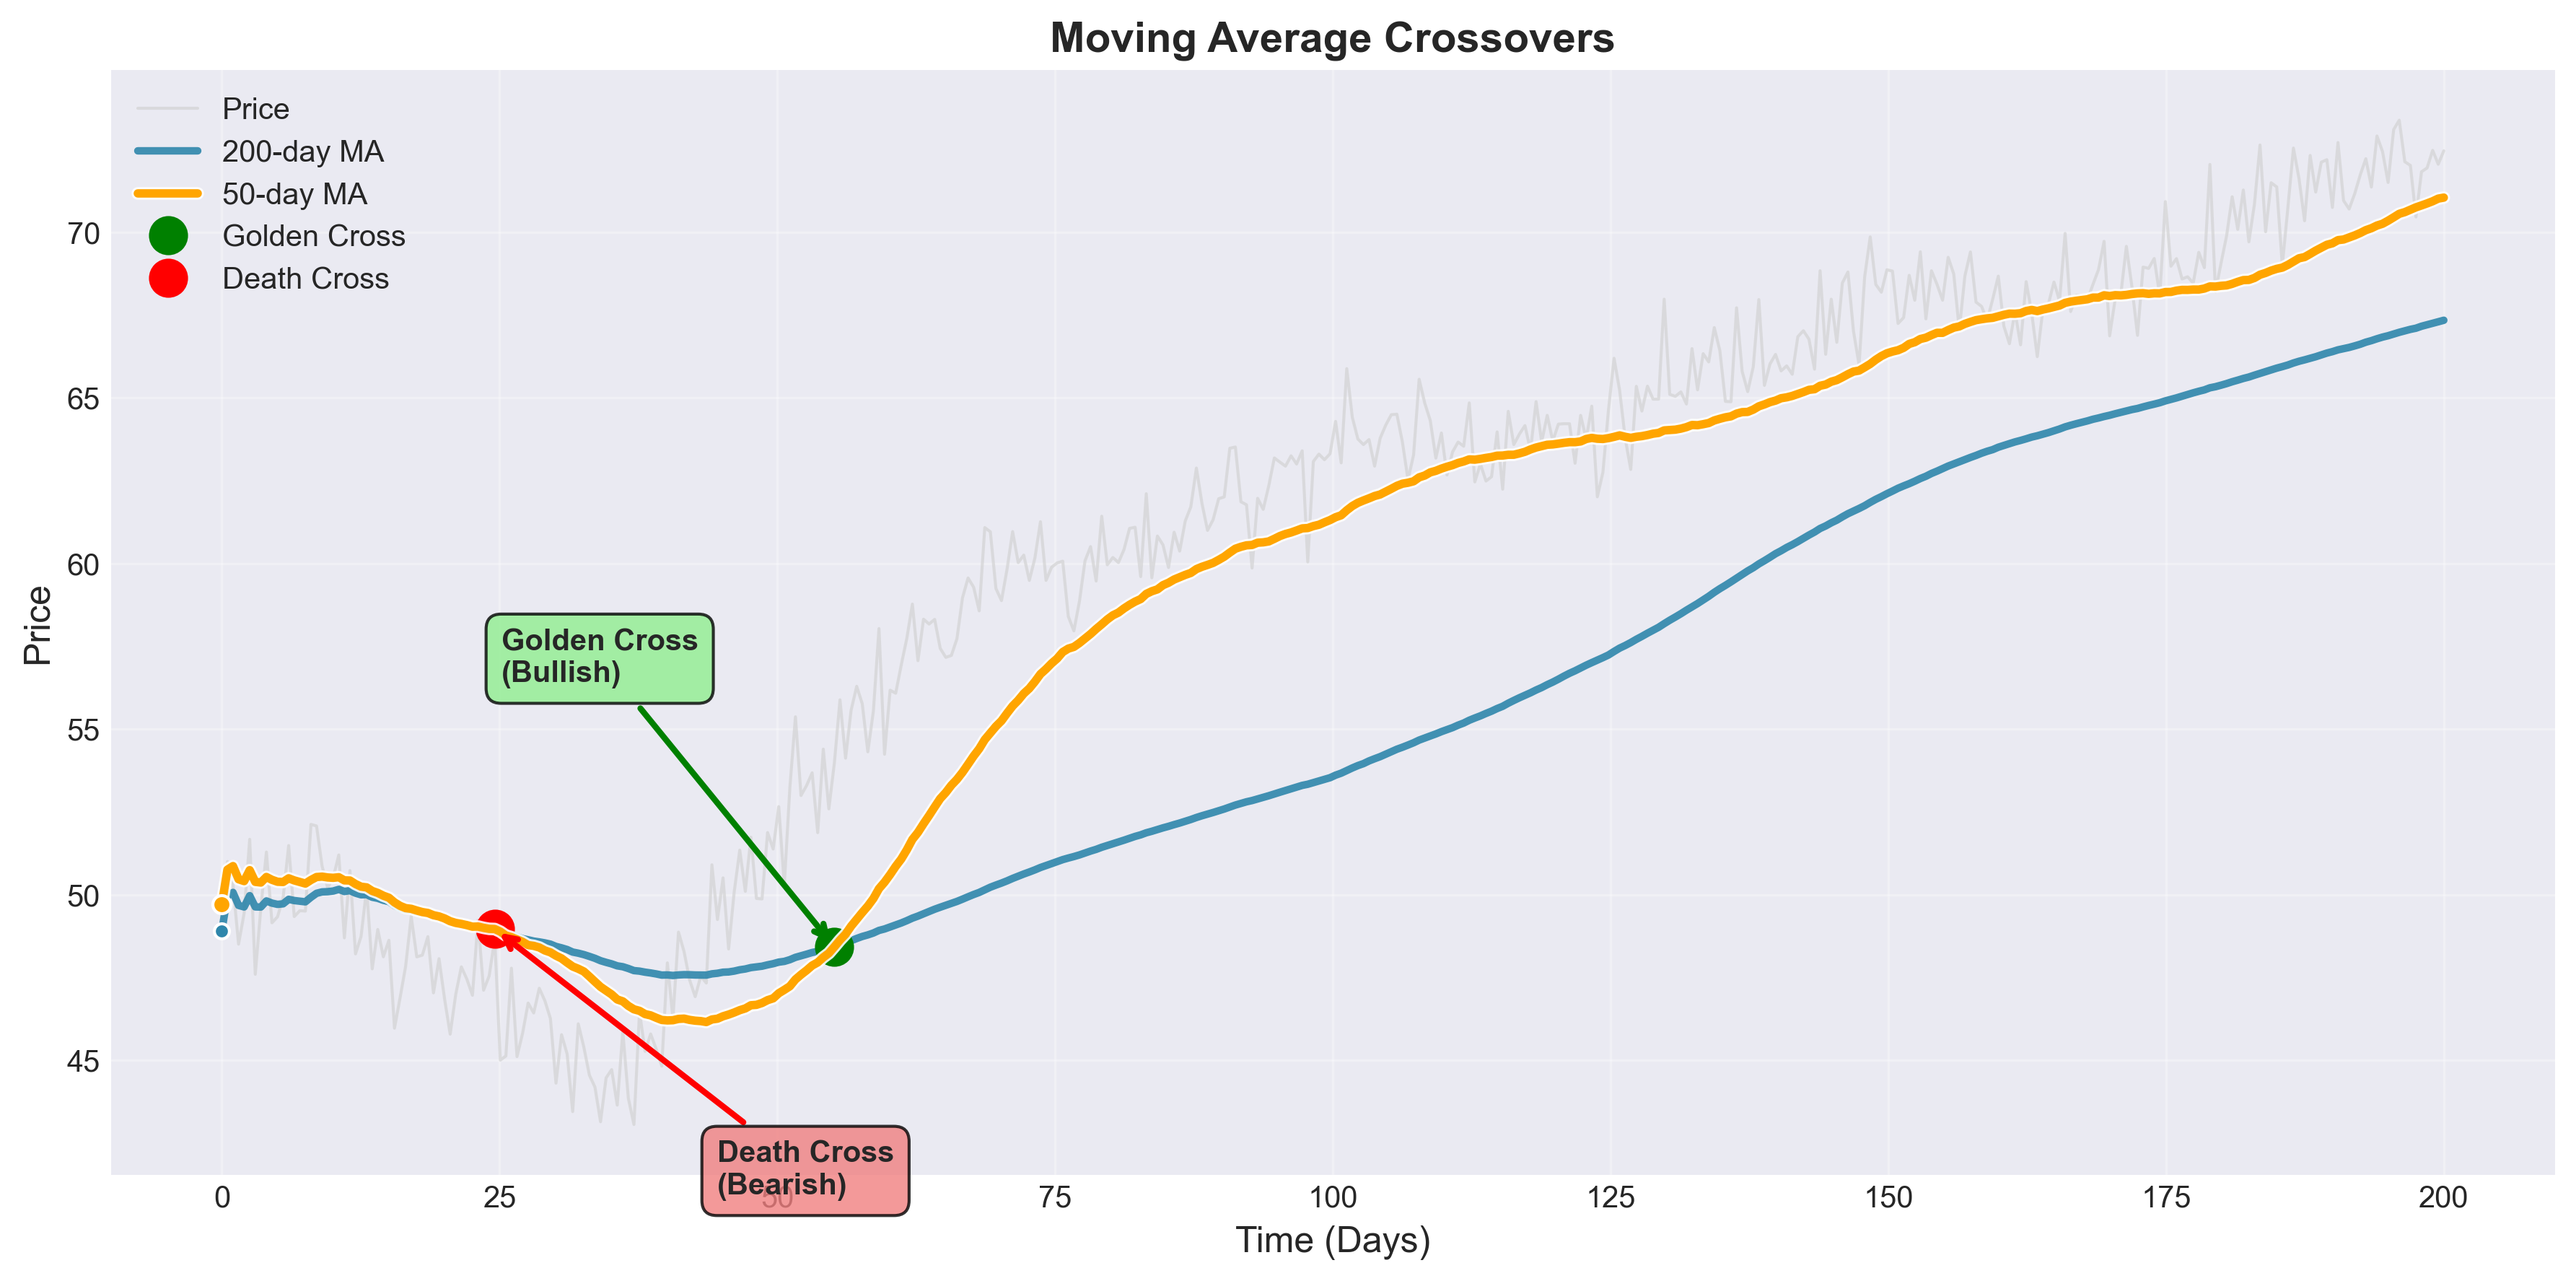
In addition to visual chart patterns, technical analysts use quantitative indicators - formula-based calculations on price, volume, or other market statistics - to aid decision-making. These technical indicators distill price and volume data into various metrics that can reveal trends or momentum not immediately obvious from the raw price chart. A simple but widely used example is the moving average, which calculates the average price over a specified past period (for instance 50 days) and plots it as a smooth line. Moving averages help filter out day-to-day noise, showing the underlying trend more clearly; when a shorter-term moving average crosses above a longer-term one (a bullish “golden cross”), it may signal upward momentum, whereas the reverse crossover (a “death cross”) can signal a downtrend.[4]
Other common indicators include momentum oscillators like the Relative Strength Index (RSI) and Stochastic Oscillator, which oscillate typically between 0 and 100 and indicate the strength or speed of price movements. These oscillators attempt to identify if an asset is “overbought” (price has risen too far, too fast, possibly due for a pullback) or “oversold” (price has fallen rapidly and may rebound). For example, RSI values above 70 are often interpreted as overbought, and below 30 as oversold.[8][10] Another popular indicator, MACD (Moving Average Convergence Divergence), combines moving averages in a way that highlights changes in trend momentum.[9]
Volume data (the number of shares or contracts traded) is another pillar of technical analysis. High trading volume on a price move gives that move more significance - for instance, a rally on unusually high volume is taken as more indicative of genuine buying interest than a rally on sparse volume. Technical analysts use indicators like On-Balance Volume (OBV) or volume oscillators to quantify buying and selling pressure.[11] There are also breadth indicators that look at the market as a whole, such as the advance/decline line (tracking how many stocks are rising vs. falling), to gauge the strength of broad market moves.[4] In addition, some technicians track sentiment indicators (though these stray toward behavioral measures) - for example, the ratio of bullish vs. bearish investors, or the put/call ratio from the options market - to infer contrarian signals when sentiment is extremely one-sided.
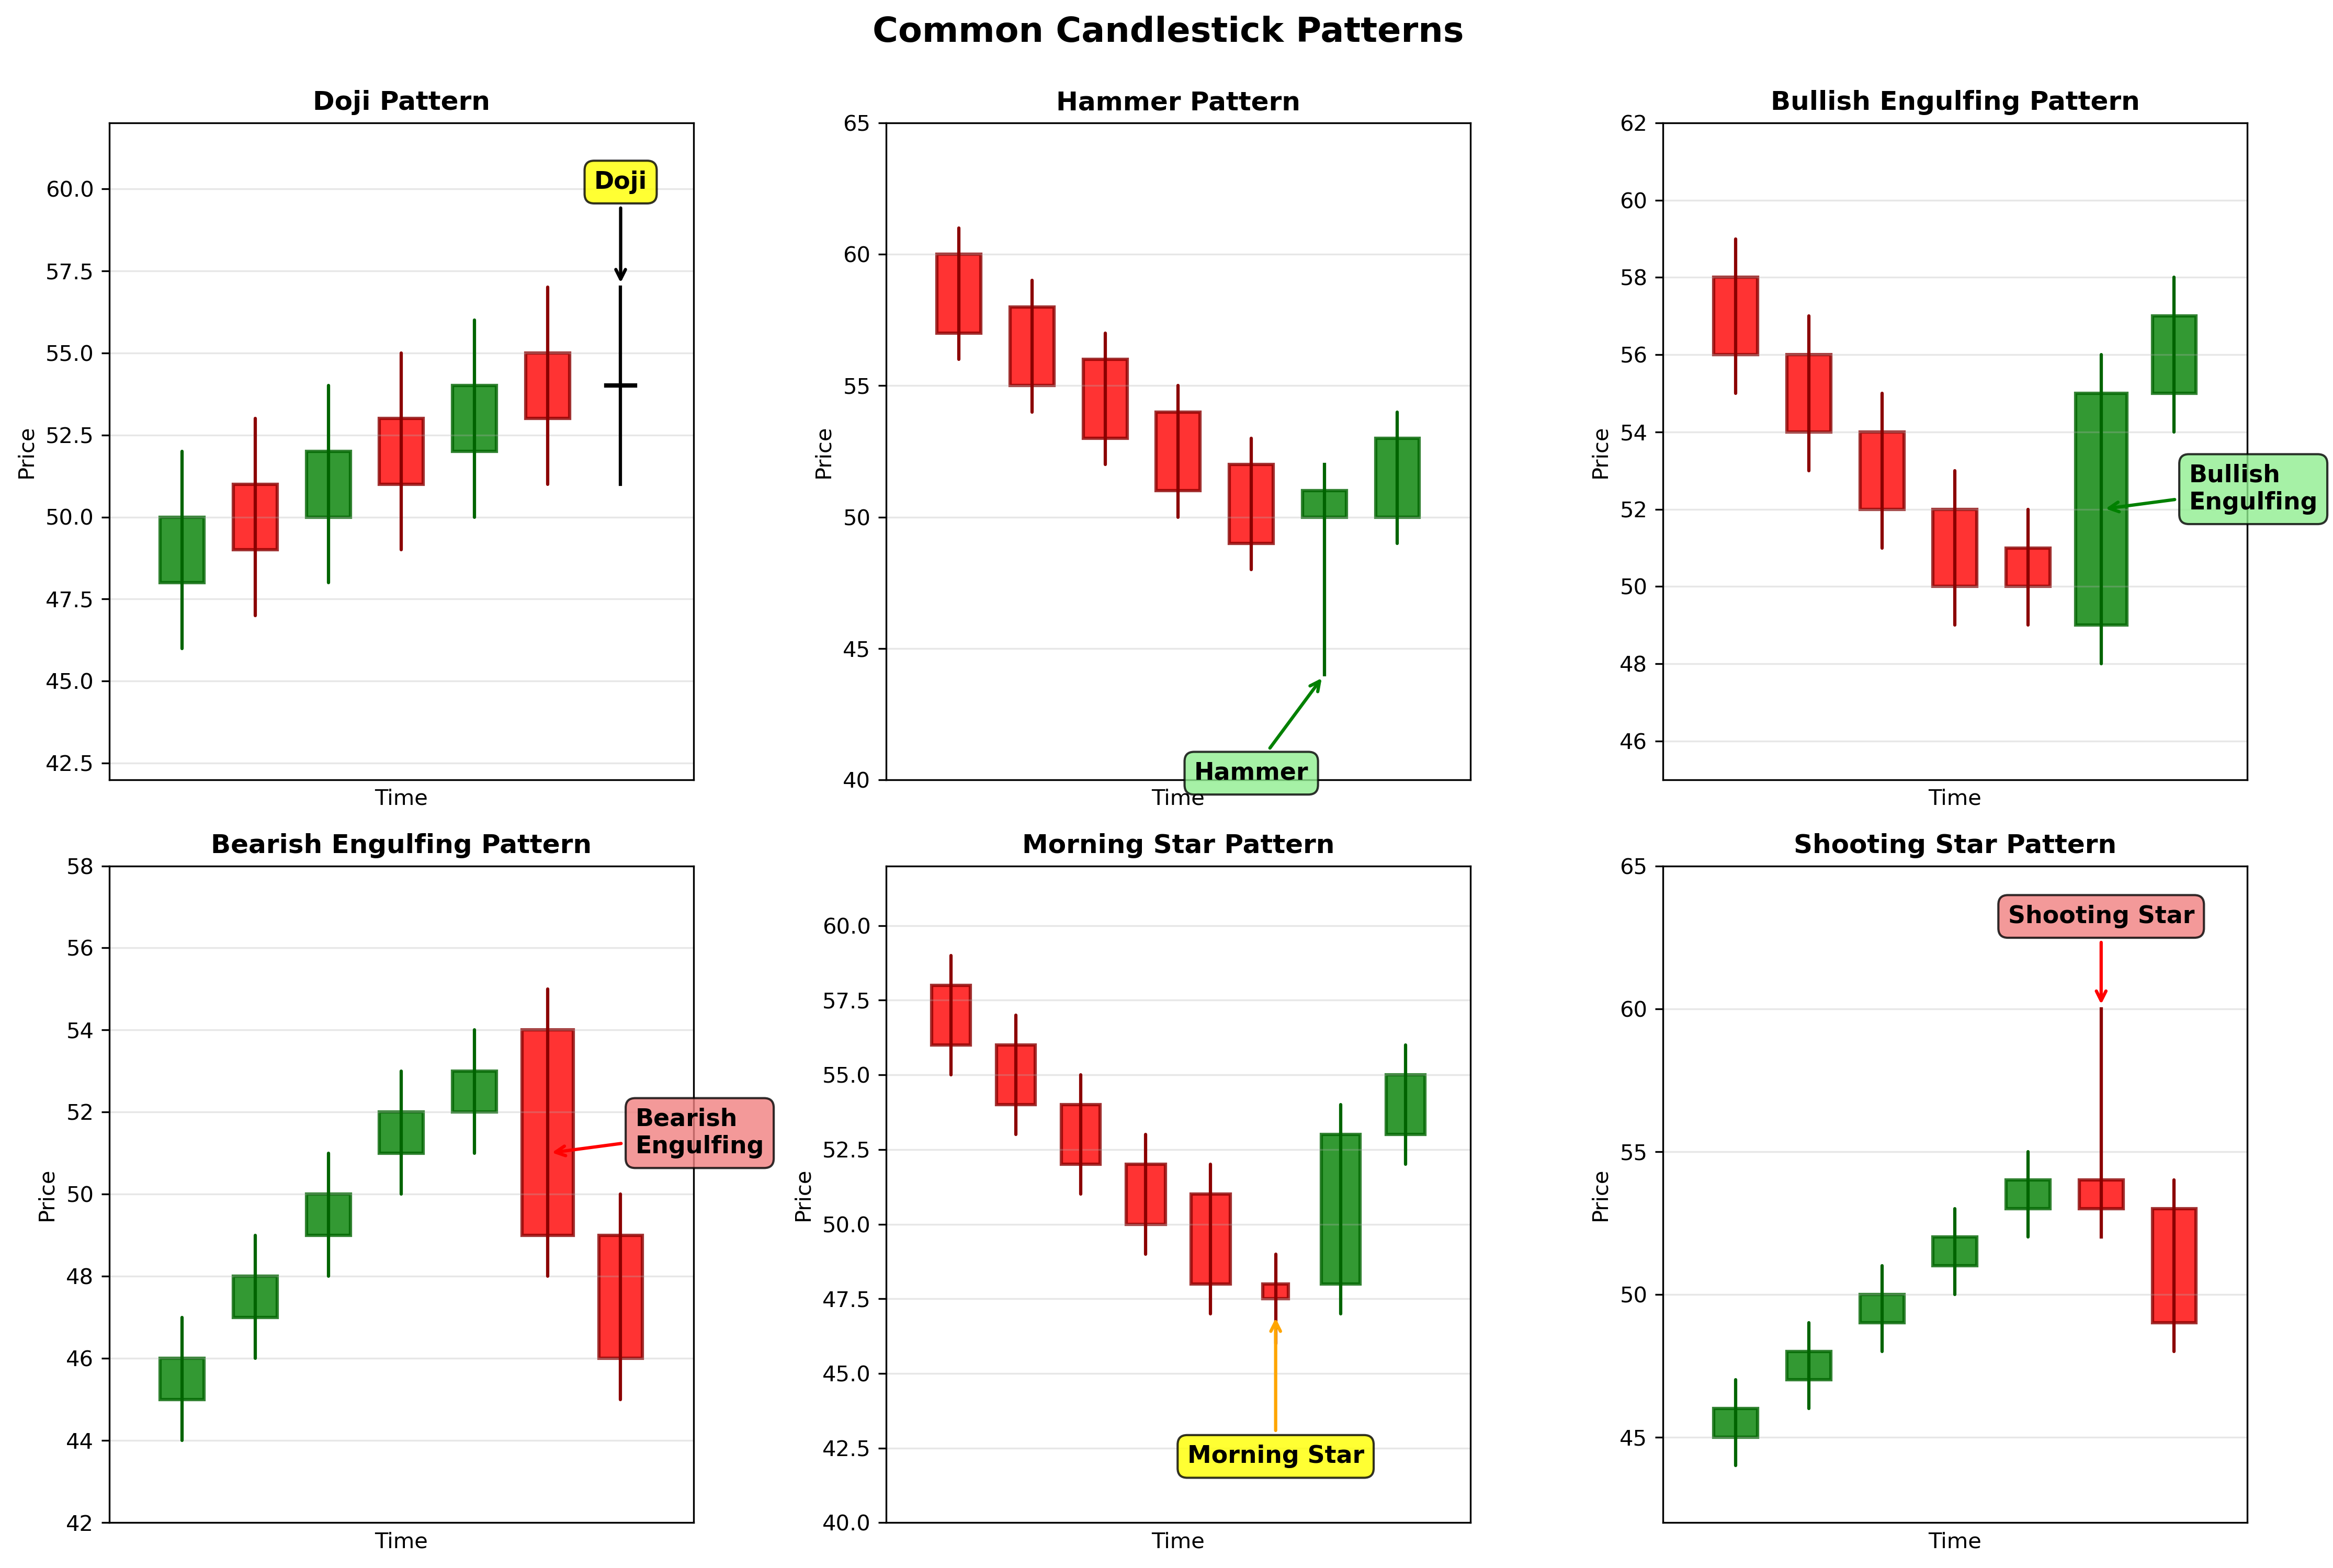
As a special case of chart patterns, candlestick charting (originating from Japanese rice trading) offers numerous short-term signals based on the shape and color of daily (or intraday) candlesticks. Each candlestick displays the period’s opening, closing, high, and low prices in a compact visual form, often colored to indicate up or down movement. Analysts have identified dozens of candlestick patterns with colorful names like doji (signifying indecision), hammer (a potential bullish reversal signal with a long lower wick), or engulfing pattern. For example, a doji candlestick occurs when the open and close prices are nearly equal, forming a cross-like shape, and may indicate that a prevailing trend is losing momentum. Candlestick patterns are valued for capturing very short-term shifts in market sentiment and are often used in combination with other tools.[6]
In practice, technical analysts will often combine multiple tools to improve reliability. For instance, they might notice a bullish chart pattern and confirm that an oscillator like RSI is showing oversold conditions before buying. By using several indicators or pattern signals together, traders try to filter out false signals (noise) and increase confidence in their decisions. There is an art to this, as using too many indicators can lead to conflicting information or “analysis paralysis.” Ultimately, technical analysis is a toolkit: some practitioners may favor pure visual chart reading, drawing trend lines and recognizing patterns by eye, whereas others may rely heavily on computed indicators or even automated pattern-recognition software. Despite the variety of methods, all share the common goal of using historical market behavior to anticipate future price movements, under the assumption that identifiable patterns and trends will recur.
Academic Debate
Technical analysis has long been a subject of debate in the finance community. Supporters argue that it provides valuable insight into market psychology and timing, while critics contend that it lacks a sound theoretical foundation and empirical consistency. Several key points highlight this ongoing debate.
Perhaps the strongest criticism comes from the efficient market hypothesis, a cornerstone of modern financial theory. EMH (especially in its weak form) asserts that all past price information is already incorporated into current prices, and therefore past price movements cannot be used to predict future prices profitably. Under a strict interpretation of EMH, any patterns observed in historical data should be essentially random or accidental; if a reliable pattern did exist, rational market participants would exploit it until it disappears. Eminent economists like Eugene Fama (who formalized EMH)[12] have argued that evidence supporting predictable price patterns is scant and that markets are largely unpredictable and efficient in processing information. The random walk hypothesis similarly suggests that price changes are random and independent, likening price series to a coin-flip sequence. Burton Malkiel, a proponent of this view, famously compared technical analysis to astrology[13], implying it has no better predictive power than star charts. He reasoned that once a “regularity” is discovered (like a chart pattern), investors will act on it and thus erase it - a self-defeating prophecy in reverse.
The academic verdict on technical analysis is not entirely dismissive; research findings have been mixed. Some studies indeed find little to no ability for simple technical rules to outperform the market on a risk-adjusted basis (consistent with EMH). However, other studies have uncovered certain anomalies and modest predictive edges. For instance, economists Andrew Lo and Craig McKinlay in the 1990s documented that stock returns were not perfectly random and that some momentum effects existed[14], suggesting that purely random-walk models might be too simple.
In a 2000 paper, Andrew Lo and colleagues applied computational algorithms to a large set of historical stock data and found that several technical indicators provided incremental information and might have practical value in forecasting returns[15]. This lends credence to the idea that markets are not fully efficient all the time - there may be pockets of predictability. That said, even proponents like Lo caution that any edges are small and can be eroded by transaction costs or competition. Critics like Malkiel respond that these small irregularities are unlikely to yield realizable profits once trading frictions and the adaptive nature of markets are considered. Overall, the academic literature has not settled the issue: technical analysis appears to work in some markets or periods (especially in shorter-term momentum), but often fails to beat simple buy-and-hold strategies after costs.
Technicians counter the EMH criticism by pointing out that financial markets are driven by humans (or human-created algorithms), who often behave irrationally or emotionally. Thus, prices can deviate from pure fundamental value in ways that are exploitable. They argue that investor expectations and biases cause patterns - for example, many investors chasing a rising stock can produce an observable uptrend, and fear-driven selling can produce panics and sharp reversals. From this perspective, past prices influence future prices precisely because human behavior tends to repeat. Research in behavioral finance supports some of these claims: cognitive biases (overreaction, herding, etc.) can lead to momentum (trends) or mean-reversion in asset prices. As one author, David Aronson, noted, behavioral finance offers explanations for why markets might have systematic price movements that technical methods could exploit.
For example, if investors as a group tend to become overly optimistic after a stock has risen (greed) and overly pessimistic after it has fallen (fear), these collective swings could create trend-following opportunities or recognizable pattern endpoints (blow-off tops, capitulation bottoms, etc.). Technical analysis can be viewed as quantifying and capitalizing on crowd psychology. Critics from the EMH camp acknowledge that individual investors are not perfectly rational, but they maintain that the market as a whole may still behave rationally due to the balancing of many participants’ views. The truth may lie in between: markets are mostly efficient most of the time, but not always, and those inefficiencies are what technical (and other active) traders seek to find.
Another criticism is the subjective nature of traditional technical analysis. Unlike a mathematical valuation formula, reading charts can be open to interpretation. Two analysts might examine the same chart and see very different patterns - one spots a head-and-shoulders, while another sees a sideways consolidation. This has been likened to seeing shapes in clouds. Because pattern recognition can be in the “eye of the beholder,” skeptics argue that chartists may impose their own biases, finding signals that confirm their pre-existing views. There’s also the issue of data mining or overfitting: given enough historical data, one can always find some pattern that would have worked in the past purely by chance.
For example, if you flip a coin 10 times and get an unusual sequence (like 8 heads in a row), you might falsely infer a “pattern,” even though it was random. In markets, thousands of indicators and pattern variations exist; it’s easy to retrospectively discover one that fit a particular period (e.g. “if you bought whenever it rained on a Tuesday and the market was up 3 days in a row, you’d profit”), but such patterns often fail going forward. This is a central challenge: separating genuinely predictive patterns from spurious coincidences. Modern practitioners try to address this by backtesting on out-of-sample data and using statistical tests to verify if a signal has real merit or is likely a fluke.
An interesting defense - and critique - of technical analysis is the idea of the self-fulfilling prophecy. Because so many traders follow certain technical signals, those signals might work because people act on them. For instance, if a large number of market participants believe that a stock breaking above its 200-day moving average is bullish, they will buy when it happens, thus driving the price higher and making the signal profitable. The same could apply to widely recognized support and resistance levels: if “everyone” sees that a stock has support at $50, many will buy at or just above $50, causing the level to hold again simply due to their collective actions. Critics note that if this is the only reason technical analysis works, it’s a fragile foundation - the patterns have no inherent meaning, they just reflect herd behavior. And if the herd were to change or lose interest, the patterns would stop working. Proponents respond that self-fulfillment at least makes technical signals useful in practice (as long as awareness remains high), and furthermore, not all technical strategies are so widely followed as to rely purely on self-fulfilling dynamics. Some also argue that even if part of technical analysis is self-fulfilling, it still requires skill to use (for example, knowing which levels are truly widely watched vs. random ones). In any case, the self-fulfilling aspect suggests a reflexive relationship between traders’ beliefs and market outcomes.
Comparison with Fundamental Analysis
Fundamental analysts often critique technical analysis for ignoring the “real” value of assets. A common argument is that technical trading is akin to driving by looking in the rear-view mirror - it’s entirely backward-looking. Fundamental analysis, in contrast, tries to evaluate what a stock should be worth based on earnings, growth, and risk, and thus can identify mispricings relative to intrinsic value. Technical analysis generally assumes that such intrinsic values are either unknowable or already included in the price, so looking at fundamentals is redundant. Detractors point out that purely technical trading can miss important one-time events or structural changes; for example, no chart pattern could predict a sudden corporate scandal or breakthrough invention that drastically moves a stock’s price.
Additionally, fundamentalists argue that long-term investment success is better achieved by understanding businesses, since price patterns might only yield short-term opportunities. On the other hand, technical analysts argue that fundamentals often don’t account for when investors decide to buy or sell - good companies can be bad investments if bought at the wrong time, and vice versa. In practice, many investors blend both approaches. They might use fundamental analysis to create a list of assets that are attractively valued, then apply technical analysis to time their entries and exits more effectively. Even fundamental-focused institutions acknowledge the value of price trends and will monitor technical factors like support/resistance or momentum as part of their trading strategies. Conversely, a technical trader may be aware of key fundamental events (earnings releases, economic reports) to avoid being blindsided. So rather than being mutually exclusive, fundamental and technical analysis can be complementary.
In summary, technical analysis has ardent advocates and equally ardent skeptics. The debate remains unresolved: academic consensus leans toward skepticism in its strongest form (especially under an efficient market view), yet numerous traders and some studies assert that at least certain technical techniques can add value. For the scientifically curious, technical analysis poses an interesting paradox - it lacks a predictive theory in the classical sense, yet it persists and even thrives among market practitioners. The ongoing challenge is determining when observed price patterns are signal versus noise, and whether human-driven markets contain exploitable inefficiencies that charts can illuminate. As markets evolve (with algorithmic trading, more data, etc.), this debate continues to be tested in real time.
Modern Usage and Applications
Today, technical analysis is pervasive in financial markets, employed by a wide spectrum of participants from individual day traders to large institutional investors. Its usage has expanded and adapted with technological advancements.
For individual traders and enthusiasts, technical analysis is often the entry point to active trading. Modern trading platforms and online brokerages provide an array of charting tools, technical indicators, and real-time data at little or no extra cost. This democratization means a solo trader can perform sophisticated technical analysis from a home computer or smartphone. In practice, many short-term retail traders (in stocks, foreign exchange, or cryptocurrencies) rely heavily on technical charts to make decisions. They scan for breakout patterns, follow moving average signals, or watch momentum indicators to decide when to buy or sell, sometimes without reference to any fundamental news. The appeal lies in the immediacy and visual nature of technical analysis - it provides actionable signals and clear rule-based strategies.
For instance, a forex day trader might use 5-minute candlestick charts and oscillators to time trades, or a cryptocurrency trader might draw support/resistance lines on a Bitcoin chart to plan entry and exit points. The retail trading community often shares chart analysis on forums and social media, further popularizing techniques. It’s worth noting that the rise of new markets like cryptocurrencies - which have 24/7 trading and often lack long histories of fundamental data - has spurred even greater reliance on technical analysis, since traders in those markets must largely gauge sentiment and momentum from price charts alone.[2] In sum, for many non-professional traders, technical analysis is the key toolkit for market participation.
Technical analysis is not limited to hobbyist traders; it also has a firm place in the professional trading world. Many hedge funds, proprietary trading firms, and commodity trading advisors employ strategies rooted in technical concepts (though they may use more complex or proprietary indicators). For example, trend-following funds in the futures market (often called managed futures or CTAs) systematically buy securities that are trending upward and sell those trending downward - a strategy directly born from technical trend principles.
These funds have existed for decades and allocate large capital based on signals like moving average crossovers or breakout above recent highs, which are straightforward technical rules. Similarly, momentum trading (buying assets that have performed well recently, selling those that have performed poorly) is a strategy utilized by many quantitative hedge funds; it straddles the line between technical and quantitative analysis, but it is fundamentally predicated on continuation of price trends. Professional market technicians often occupy roles in investment banks or research firms, producing chart-based analysis to supplement fundamental research. Even when an institution’s primary approach is fundamental, they might consult technical analysts for timing advice - for instance, an asset manager might wait for a stock to break above a technical resistance level before adding to a position, to ensure they are not buying into a downward trend.
Algorithmic and Systematic Trading
The advent of algorithmic trading has in many ways automated and validated the use of technical signals. Algorithmic trading systems execute pre-defined rules without human intervention - and many of those rules are based on technical criteria. In fact, some of the most common algorithmic trading strategies are essentially formalized technical analysis: trend-following algorithms that react to moving average crossovers or channel breakouts, mean reversion strategies that buy when prices deviate too far below an average, and so on. For example, a simple algorithmic strategy might be: “Buy 50 shares of a stock when its 50-day moving average rises above its 200-day moving average; sell when the 50-day falls below the 200-day”. This coded rule mirrors what a human technical trader might do, but the computer can monitor many assets simultaneously and execute instantly when conditions meet. Because algorithms strip out emotional decision-making, they are a natural fit for technical rules that require discipline (e.g. adhering to stop-loss levels or entry triggers precisely). High-frequency trading (HFT), a subset of algorithmic trading, operates on extremely short time scales (milliseconds to seconds) and often uses order book imbalances, arbitrage, or very short-term price patterns to make profits.
While HFT is more about speed and statistical arbitrage than classical chart patterns, it still relies on identifying patterns in market data - just at a microstructural level (like recognizing a temporary mispricing between markets, or a flurry of buy orders that usually pushes a price up briefly). In a sense, HFT algorithms are continuously performing technical analysis on ultra-short-term data, albeit with advanced methods. The majority of trading volume in modern equity and forex markets is now driven by algorithmic strategies, which means that technical rules are being executed at scale by machines. This has changed market dynamics - trends can strengthen or reverse very rapidly when algorithms align, and certain patterns may have become less reliable as they get arbitraged faster. Nonetheless, the core idea remains: computers are systematically exploiting historical patterns and relationships in price data, which is essentially technical analysis by another name.
Advanced Analytics - Neural Networks and AI
In recent years, technical analysis has also intersected with fields like machine learning and artificial intelligence. Researchers and quantitatively-oriented firms have experimented with artificial neural networks and other AI models to detect complex nonlinear patterns in market data that might elude a human chart reader. These models can ingest not only price and volume, but sometimes a mix of technical and fundamental inputs, and “learn” to make trading decisions. Some studies have claimed that AI-driven technical models can outperform simpler strategies and even beat buy-and-hold returns, by finding subtle combinations of indicators or patterns that signal trades.
For example, a neural network might learn that a certain interplay between multiple indicators (say, a particular pattern in moving average slopes combined with an RSI divergence and a spike in volume) predicts an upcoming price jump with higher-than-random odds. While many such AI approaches remain proprietary or experimental, they represent the modern extension of technical analysis - essentially trying to enhance pattern recognition through computing power. Importantly, these techniques allow backtesting on massive datasets: analysts can simulate how a given technical rule or model would have performed on historical data (out-of-sample testing) to statistically assess its validity before risking real capital. The availability of decades of price data and powerful computers means technical analysis is increasingly evidence-based (at least among serious practitioners): strategies can be objectively evaluated and iteratively improved.
Usage Across Markets
Another aspect of modern technical analysis is its application to virtually all types of markets. Originally developed in stock trading, technical methods have been applied to bonds, commodities, foreign exchange, derivatives, and cryptocurrencies. Many traders assume that if a market has sufficient liquidity and is driven by supply and demand dynamics, technical analysis can be useful. For example, commodity and currency traders often rely on chart analysis since those markets can be heavily influenced by technical factors (like traders watching key price levels). Even in markets where fundamental values are well-known (say, government bonds with fixed interest payments), short-term price fluctuations can still exhibit trends or reversals that technicians attempt to trade. As noted by a recent source, from traditional assets like commodities and bonds to emerging assets like crypto, traders use technical analysis to find opportunities and guide decisions.[2] The universality of charts makes technical analysis a common language among traders around the world, regardless of the asset class.
In the institutional context, technical analysis today often complements other analysis methods. A portfolio manager might use macroeconomic research to decide which markets to invest in, but then use technical analysis to fine-tune the timing of entries. A risk manager might monitor technical indicators (like volatility measures or trend strength) to adjust position sizes or hedges. The integration of technical tools is such that even those who do not identify as “technicians” may still be influenced by technical factors (for instance, a CEO might delay a secondary stock offering if the company’s stock is technically in a downtrend, to avoid selling at a low price).
Summary
In summary, technical analysis has grown from a niche practice of chart readers into a broad discipline that permeates modern trading. It thrives in retail trading circles and has also been embedded in algorithmic trading algorithms used by institutions. Its core appeal remains the same: by studying what the market has been doing, traders hope to infer what it will do next. While it cannot predict the future with certainty, technical analysis provides a framework for making probabilistic bets and managing risk (through observed price levels for stop-losses, etc.). Despite all the advancements in data and computing, markets are still driven by human (and human-programmed) behavior, which means price patterns and investor psychology continue to play a critical role. For the scientifically curious observer, technical analysis in the modern era offers a fascinating intersection of finance, data science, and psychology - a toolkit that is constantly being tested and refined in the only laboratory that matters, the live markets.
References
- 1.Investopedia. "Head and Shoulders Pattern." https://www.investopedia.com/terms/h/head-shoulders.asp ↩
- 2.Kraken Learn. "Introduction to Technical Analysis." https://www.kraken.com/learn/technical-analysis ↩
- 3.Edwards, R. D., & Magee, J. Technical Analysis of Stock Trends. (McGraw-Hill) ↩
- 4.Murphy, J. J. Technical Analysis of the Financial Markets. (New York Institute of Finance) ↩
- 5.Bulkowski, T. Encyclopedia of Chart Patterns. (Wiley) ↩
- 6.Nison, S. Japanese Candlestick Charting Techniques. (Prentice Hall) ↩
- 7.O’Neil, W. J. How to Make Money in Stocks. (McGraw-Hill) - cup-with-handle pattern ↩
- 8.Wilder, J. W. New Concepts in Technical Trading Systems. (Trend Research) - RSI origin ↩
- 9.Appel, G. Technical Analysis: Power Tools for Active Investors. (Financial Times/Prentice Hall) - MACD ↩
- 10.Lane, G. C. The Stochastic Oscillator. (Articles/lectures by George C. Lane) ↩
- 11.Granville, J. E. Granville’s New Key to Stock Market Profits. (Prentice Hall) - On-Balance Volume ↩
- 12.Fama, E. F. Efficient Capital Markets: A Review of Theory and Empirical Work. The Journal of Finance (1970) ↩
- 13.Malkiel, B. G. A Random Walk Down Wall Street. (W. W. Norton & Company) ↩
- 14.Lo, A. W., & MacKinlay, A. C. A Non-Random Walk Down Wall Street. (Princeton University Press) ↩
- 15.Lo, A. W., Mamaysky, H., & Wang, J. Foundations of Technical Analysis: Computational Algorithms, Statistical Inference, and Empirical Implementation. The Journal of Finance (2000) ↩
- 16.Wyckoff, R. D. The Richard D. Wyckoff Method of Trading and Investing in Stocks. (Wyckoff Associates) - or biography resources ↩
- 17.Elliott, R. N. R. N. Elliott’s Masterworks. (New Classics Library) - Elliott Wave Theory ↩
- 18.Gann, W. D. W.D. Gann: Stock Market Profits/Methods (various publications) ↩
- 19.CMT Association. cmtassociation.org - Professional body for market technicians ↩
- 20.International Federation of Technical Analysts (IFTA). ifta.org - Global association of technical analysts ↩